Why this matters
Pressure sensitive adhesives (PSAs) are critical in the construction, food packaging, electronics and medical industries, and the segment is expected to grow by around 6% by 2030. PSA manufacturers continue efforts to commercialize materials that meet stringent customer requirements in existing and new applications.
The key use properties of pressure sensitive adhesives are tack (stickiness), peel strength (adhesion) and shear strength (cohesion). These properties are strongly influenced by fundamental polymer properties like molecular weight (Mw) and intrinsic viscosity (IV). These properties naturally differ from recipe to recipe and also may vary with subtle differences in process conditions within a given recipe.
ACOMP is an online, smart manufacturing system that continuously monitors polymer properties in real time. This technical note describes the use of ACOMP to monitor polymerization kinetics, intrinsic viscosity and Mw in a very common system for producing pressure sensitive adhesives, which uses the acrylic comonomers acrylic acid (AA) and 2-ethylhexyl acrylate (2EHA).
Methodology
In practical applications of pressure sensitive adhesives, various monomers are copolymerized with 2EHA. These include methyl methacrylate (MMA), cyclohexyl methacrylate (CHMA) and acrylic acid (AA). Among these, acrylic acid is the most challenging to incorporate because polyacrylic acid is insoluble in the solvent ethyl acetate; however, the copolymerization of 2EHA and AA is soluble in this organic solvent.
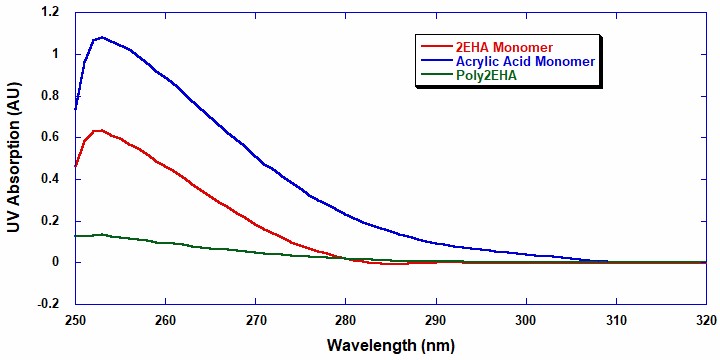
A UV/Visible light batch spectrometer (UV/Vis) was utilized to investigate the absorption wavelength range applicable for the analysis of monomer conversion during the reaction. The monomer and polymer samples were prepared at 1 mg/ml in ethyl acetate. Figure 1 shows that above the UV-cutoff wavelength of ethyl acetate, which is 255 nm, 2EHA has a strong absorption peak from 255 nm to approximately 287 nm.
Conversely, acrylic acid has a broader peak up to 310 nm with AA exhibiting a higher extinction coefficient than 2EHA. This means that UV can quantitatively analyze the conversion and composition of each monomer in each copolymerization. The UV range from 288 nm to 310 nm is useful when determining the conversion and concentration of AA, while the UV absorption range from 255 nm to 287 nm can determine the conversion and concentration of 2EHA.
The ACOMP UV/Vis uses four wavelengths, 260 nm, 270 nm, 290 nm and 310 nm, for measuring the absorption of monomer. A single capillary viscometer and a 5-angle light scattering detector were used to measure the intrinsic viscosity and weight-average molecular weight (Mw) of the polymer. The determination of Mw requires knowledge of the differential refractive index by concentration (dn/dc) for monomer and polymer, and these parameters were determined in advance using an Automatic Continuous Mixing method (ACM).
The ACOMP system extracted a continuous sample from the reactor’s recirculation loop at the rate of 0.25 ml/min. This sample was then diluted 150 times with ethyl acetate, the same solvent used in the reactor, to condition the polymer sample to a low enough concentration to reveal the polymer’s intrinsic characteristics.
Reactions: Pressure Sensitive Adhesives
Two batch reactions of 2EHA homopolymer and 2EHA/AA copolymer were conducted using ethyl acetate (EA) as a solvent at a constant temperature of 60˚C. The reactions started with 22.7% total monomer concentration by mass and 0.36% initiator (AIBN). The reactor contents were purged with nitrogen for one hour prior to the start of the polymerization.
| Reaction Type | Ethyl Acetate (solvent) | 2-Ethylhexyl Acrylate | Acrylic Acid | AIBN |
| Poly2EHA | 250.4 g (277.6 ml) | 73.64 g (83.21 ml) | 0 | 0.3 g |
| Poly2EHA-AA | 250.4 g (277.6 ml) | 68.04 g (76.88 ml) | 5.85 g (5.6 ml) | 0.3 g |
Table 1: Reaction conditions for each polymerization
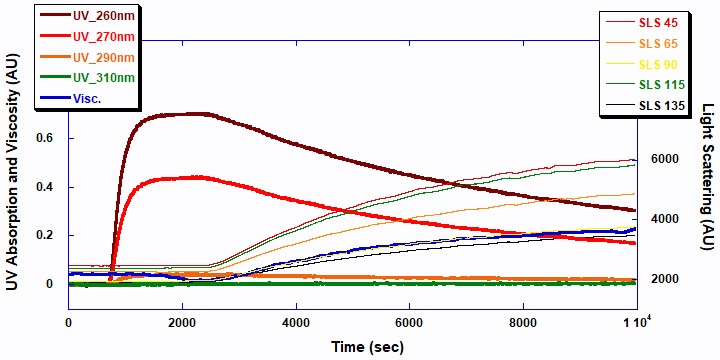
As shown in Figure 2, ACOMP successfully monitored the evolution of the first polymerization, Poly2EHA, as well as the properties of the polymer formed. Note that this Figure, as well as Figure 3, includes the period for charging of the monomers; the polymerization starts at the time when the UV signals start to decrease and the light scattering signals start to increase. The signals are expressed as raw output in Arbitrary Units (AU) and are shown on the same (left) axis for simplicity.
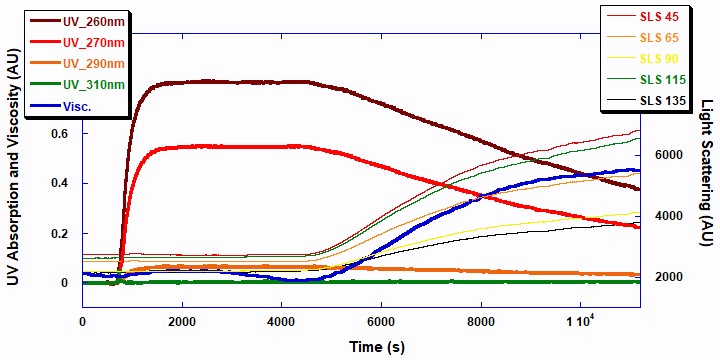
The two UV signals at 260 and 270nm decrease in a first order exponential manner as the double bonds in the monomer break to form polymer. The 5-angle light scattering signals are plotted against the right axis. The viscosity and 5-angle light scattering signals increase with the polymerization as the molecular chains of the polymer increase in mass. Figure 3 displays the raw ACOMP signals from the copolymerization reaction of 2EHA and AA.
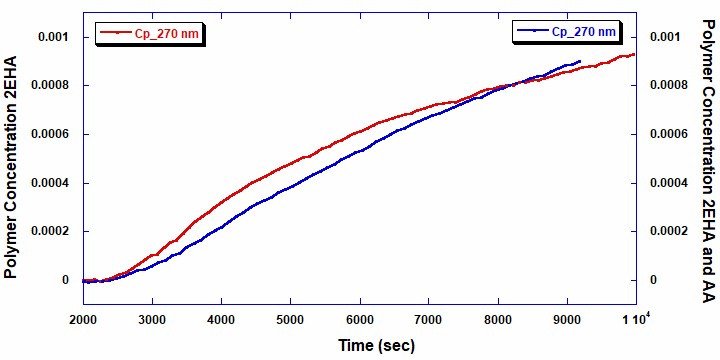
The total polymer concentrations shown in Figure 4 were measured using the data from the UV/Vis detector at 270 nm (red line: homopolymer 2EHA and blue line: copolymer 2EHA and AA). Naturally, the polymer concentration increases proportionally with decreasing concentration of the total monomer. While beyond the scope of this note, this information could be used to obtain further details about the reaction kinetics and reactivity of the monomers in both the homopolymer and copolymer reactions.
Figures 5 and 6 show the intrinsic viscosity and weight average molecular weight vs polymer concentration for the two reactions . It can be seen that in the copolymerization of Poly2EHA-AA, both the weight-average molecular weight and viscosity start off at a higher value than in the homopolymerization of Poly2EHA. The copolymerization also exhibits a decrease in Mw once the AA monomer is fully consumed. After this point, the remainder of the polymerization produces the homopolymer 2EHA.
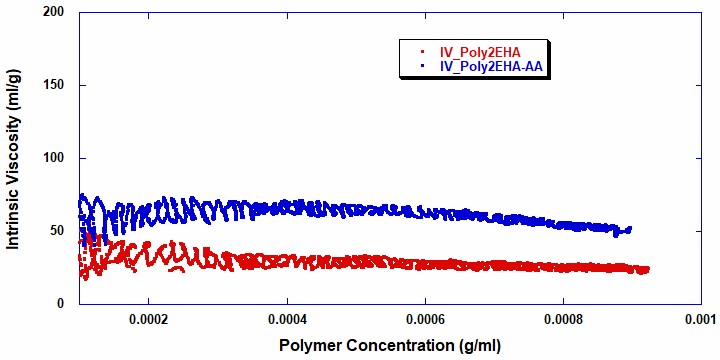
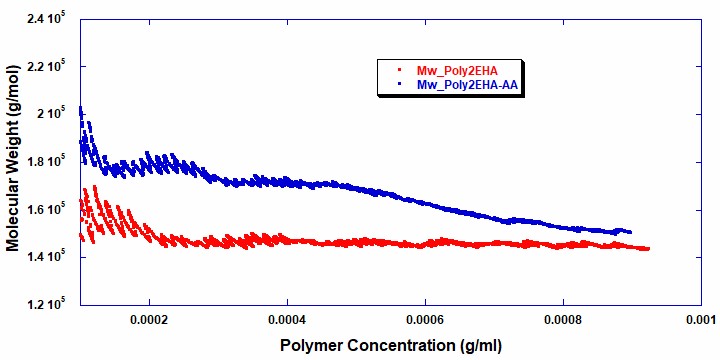
Table 2 shows the final molecular weight and intrinsic viscosity values for the pressure sensitive adhesives, along with the values for Mw measured by Gel Permeation Chromatography (GPC), the technique most commonly used in the polymer industry for molecular weight measurements.

The GPC result for the homopolymer 2EHA is very close to the ACOMP measurement. This means using ACOMP to monitor the homopolymer reaction can provide a real-time, online characterization of molecular weight that is equivalent to GPC. However, the GPC result for the copolymer 2EHA-AA is significantly higher than the Mw from ACOMP. This is due to the early incorporation of AA to the Poly2EHA which increased the hydrodynamic volume of the molecules in a dilute state, causing a higher Mw result from GPC.
It should be noted that ACOMP’s measurement is an absolute molecular weight based on physical theory, whereas GPC’s molecular weight measurement is inherently based on the calibration standard of a sample’s elution through a gel column. The higher polydispersity of the copolymer product as measured by GPC also reflects the exhaustion of AA in the polymerization, resulting in an abundance of small chain 2EHA homopolymers that formed at the end.
The ACOMP results in Table 2 show that the addition of acrylic acid actually does not significantly affect the absolute Mw of the final product. This is a useful insight since the commonly-used GPC measurement would lead one to conclude that the AA has a major impact on Mw, which might be expected to affect properties of pressure sensitive adhesives.
Conclusion
The free radical polymerizations of 2-ethlyhexyl acrylate and 2-ethylhexyl acrylate/acrylic acid in ethyl acetate solvent are easily monitored and analyzed by ACOMP. This technical note demonstrates that useful results for conversion, polymer concentration, intrinsic viscosity and molecular weight for pressure sensitive adhesives can be obtained in real time by using ACOMP. In the case of molecular weight, an absolute value is determined based upon physical theory which is not impacted by how the molecules pass through a column.
ACOMP is a powerful tool for the analysis of polymerization reactions from R&D to the industrial scale and can be customized for various chemistries and production environments.
References
- Reed, W.F. “Automated Continuous Online Monitoring of Polymerization Reactions (ACOMP) and Related Techniques.”Encyclopedia of Analytical Chemistry, 2013, 1-40, DOI: 10.1002/9780470027318.a9288.
- Yana Peykova, Et al. “Adhesive properties of acrylate copolymers: Effect of the nature of the substrate and copolymer functionality” International Journal of Adhesion and Adhesives. 2012(34), 107-116


