Why this matters
Styrene-butadiene rubber (SBR) was originally developed in the 1930s and commercialized during World War II as a replacement for natural rubber in vehicle tires. In the 21st Century, because of the increased interest in improving fuel efficiency, Solution SBR (SSBR) began to replace traditional SBR that is produced in an emulsion process. This was done to enhance the rolling resistance properties in car tires, which are related to hysteresis in the polymer. SSBR currently accounts for roughly half of the global market for SBR, and this continues to increase year over year.
During the production of SSBR, a coupling reaction is frequently employed to broaden the molecular weight distribution (MWD), and this further improves the desired material properties for tire applications. Other important parameters include long-chain branching (concentration and distribution) and the comonomer ratio and sequence distribution. Controlling the coupling process is extremely important to optimize the desired properties of the material.
Automatic Continuous Online Monitoring of Polymerizations (ACOMP) was used to continuously measure the anionic polymerization of solution styrene butadiene rubber. ACOMP successfully tracks conversion, along with weight-average molecular weight (Mw), and low and high shear reduced viscosities (RV), including during the coupling reaction. The effect of the coupling agent was directly monitored and showed approximately a doubling in Mw over time, as well as increases in RV.
ACOMP yields continuous data on these important characteristics of the reaction and the resulting polymer. These polymer properties include conversion, molecular weight, reduced viscosity, and shear-thinning viscosity.
Methodology
The solution styrene butadiene rubber polymerization was carried out in a 20-liter batch reactor. The monitored reaction was an anionic copolymerization of styrene (127 grams, 1215 mmol) and butadiene (508 grams, 9390 mmol) performed in hexane solvent at 14 weight% total monomer using a catalyst of n-BuLi (4.5 mmol) and ditetrahydrofurylpropane (2.9 mmol). Once the initial polymerization was essentially complete, the coupling agent, tin tetrachloride (1.1 mmol), was added to the reactor, resulting in the coupling of the living polymer chains.
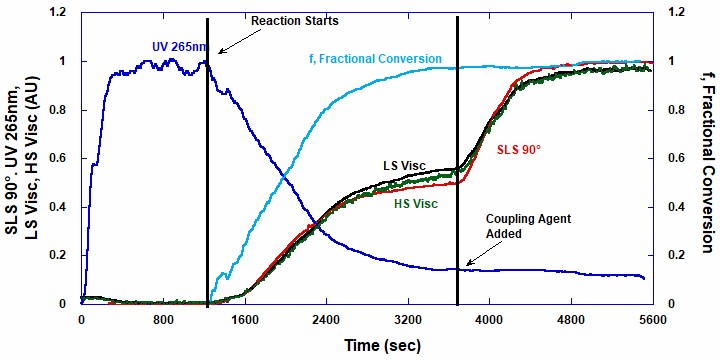
Figure 1 shows raw detector signals for UV Absorption (UV), Static Light Scattering (SLS), and high and low shear viscometers on the left axis.
The UV signal in Figure 1 does not return to its solvent value, due to scattering and absorption by the polymer that has formed. The fractional conversion on the right axis is determined by a procedure for dynamically removing the polymer scattering and absorption, thus yielding the true polymer concentration and conversion. This feature was developed by Fluence Analytics and is included in the ACOMP software package. These signals are normalized to a scale of 1.
The decay of the UV signal at 265 nm shows the conversion of the styrene into polymer. The light scattering at 90˚ increases with respect to increasing polymer mass, and it reaches a plateau during the first phase. When the reaction begins, both viscosity signals increase until a plateau is reached. The addition of the coupling agent causes strong increases in both viscometers.

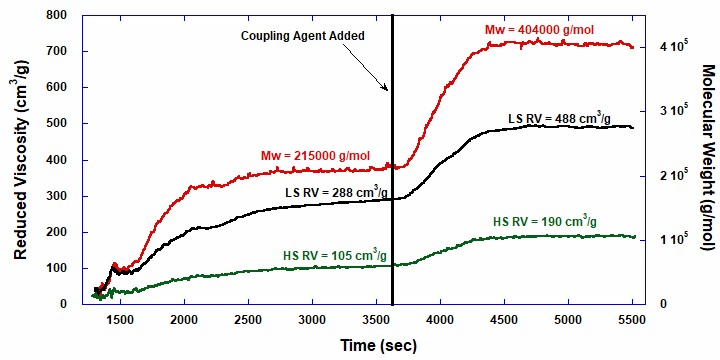
Figure 2 shows weight-average molecular weight and low and high shear Reduced Viscosity vs. time, including the coupling reaction. When using ACOMP, Mw is derived from rigorous physical theory applicable at very low concentrations. ACOMP uses Static Light Scattering with extrapolation from five angles (45˚, 65˚, 90˚, 115˚, 135˚) to zero angle. Figure 2 reveals several features. First, both Mw and low and high shear RV increase monotonically in the first phase of this anionic polymerization (in contrast, in free radical reactions, chains are initiated, propagate, and terminate quickly, so Mw decreases versus time). Examining the first and second plateau values shows that Mw,2 is roughly double Mw,1, indicative of a robust coupling reaction. Similarly, high and low shear RV increase in the first phase, again exhibiting ‘living’ type behavior of the reaction, and increase after coupling.

It is important to point out that ACOMP is not a chromatographic method, but rather it provides for the continuous, real-time detection of the weight-average molecular weight based on physical theory. With GPC, Mw is derived from a calibration curve, usually based on polystyrene standards. Two sample aliquots were taken before and after the coupling agent was added to the reactor for characterization by conventional GPC standard calibration. The GPC elution charts for each sample clearly revealed two molecular weight peaks, consistent with the evolution of the polymerization as monitored by ACOMP. The final product was determined to have a Mw of 132,000 g/mol for the low molecular weight peak and 300,000 g/mol for the high molecular weight peak.
Conclusion
ACOMP has proven the capability to directly monitor and characterize polymer conversion, weight-average molecular weight, and reduced viscosity of polymers produced during a living, anionic solution styrene butadiene rubber reaction. This information provides useful insights into production rates and efficiencies, enabling improved cycle times and yields while achieving product consistency from batch to batch. These parameters can be correlated with important rheological properties of polymer end products such as Mooney Viscosity and tan δ, which represent hysteresis in the material. For additional reading on ACOMP in rubber applications, please visit the EPDM technical note.
Acknowledgements
This work was conducted in cooperation with Bridgestone Research Americas. Fluence Analytics wishes to acknowledge Piotr Kozminski and Terry Hogan of Bridgestone Research Americas (Akron, OH) for their support.


